Difference between revisions of "2014-01 Cool Down Analysis"
From Nuclear Physics Group Documentation Pages
Jump to navigationJump to search| Line 15: | Line 15: | ||
|- | |- | ||
! colspan="3" | AMI Magnetic Field Mapping at 7T | ! colspan="3" | AMI Magnetic Field Mapping at 7T | ||
| + | |- | ||
| + | | colspan="3" | [[Image:2014-01-magmap-ami.pdf|1200px]] | ||
|- | |- | ||
| colspan="3" | [[Image:2014-01-magmap-ami.jpg|1200px]] | | colspan="3" | [[Image:2014-01-magmap-ami.jpg|1200px]] | ||
|- | |- | ||
|} | |} | ||
Revision as of 18:48, 21 March 2014
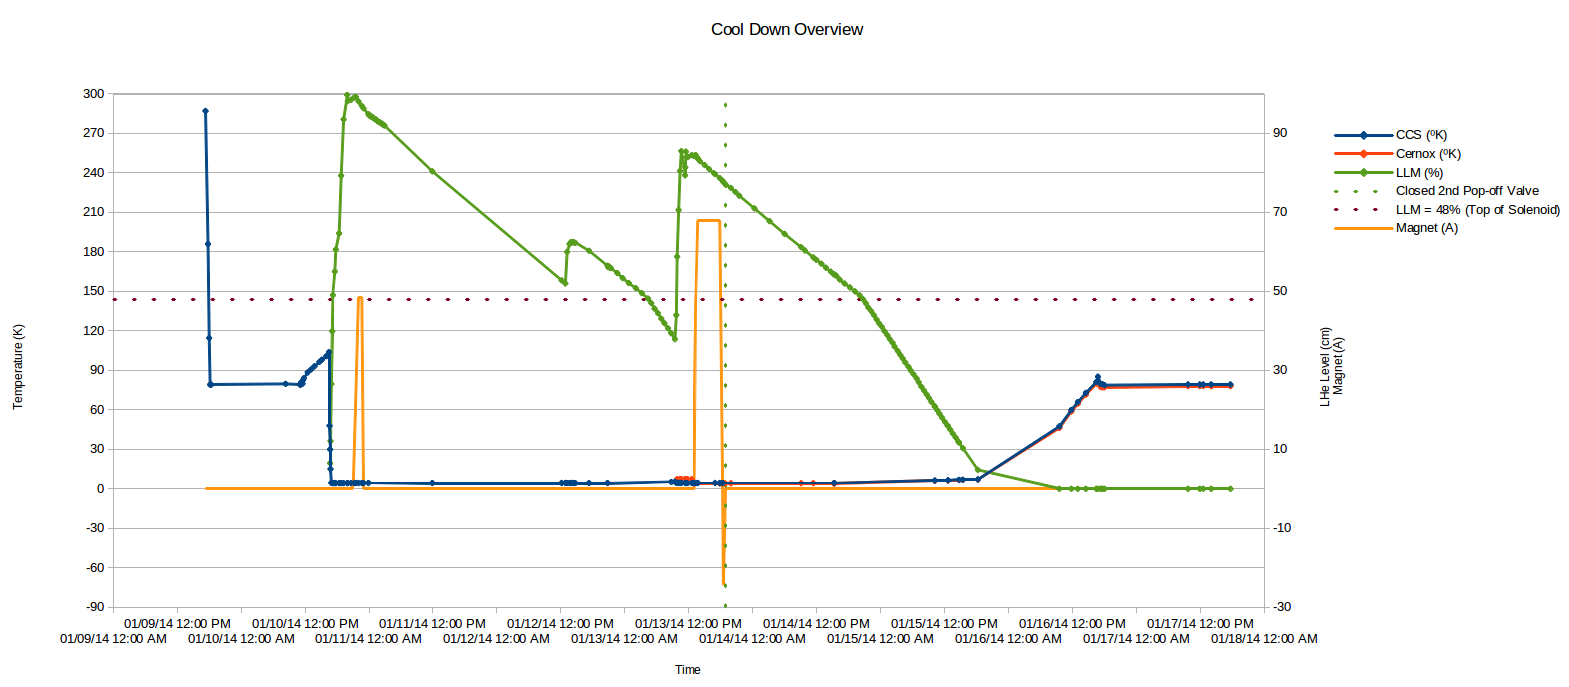
Overview of Cool Down
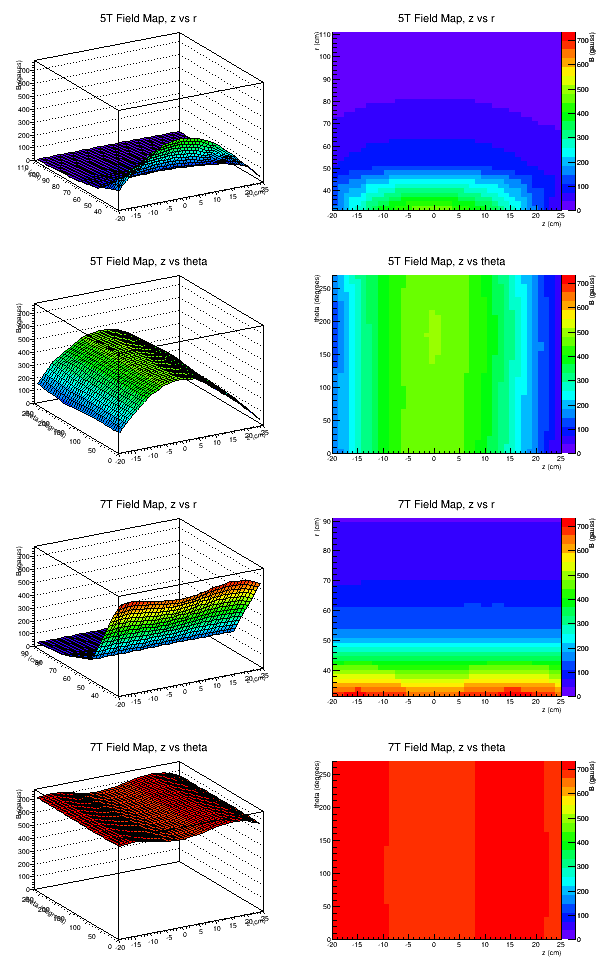
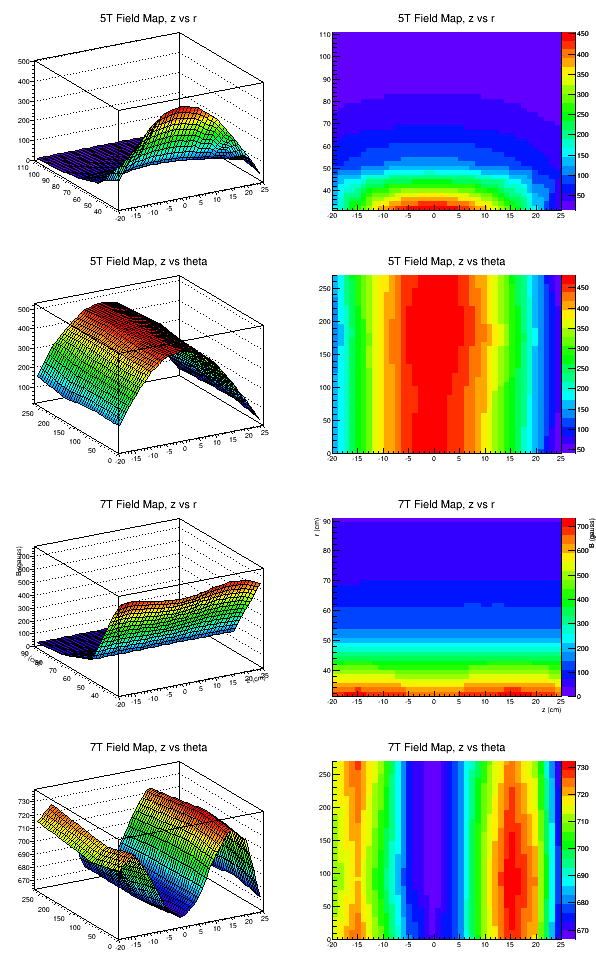
Magnetic Field Mapping
Note that r=0 is right on the surface of the thermostat, not the center of the magnet
| Scales are the same on each plot | Scales are different on each plot | |
|---|---|---|
 |

| |
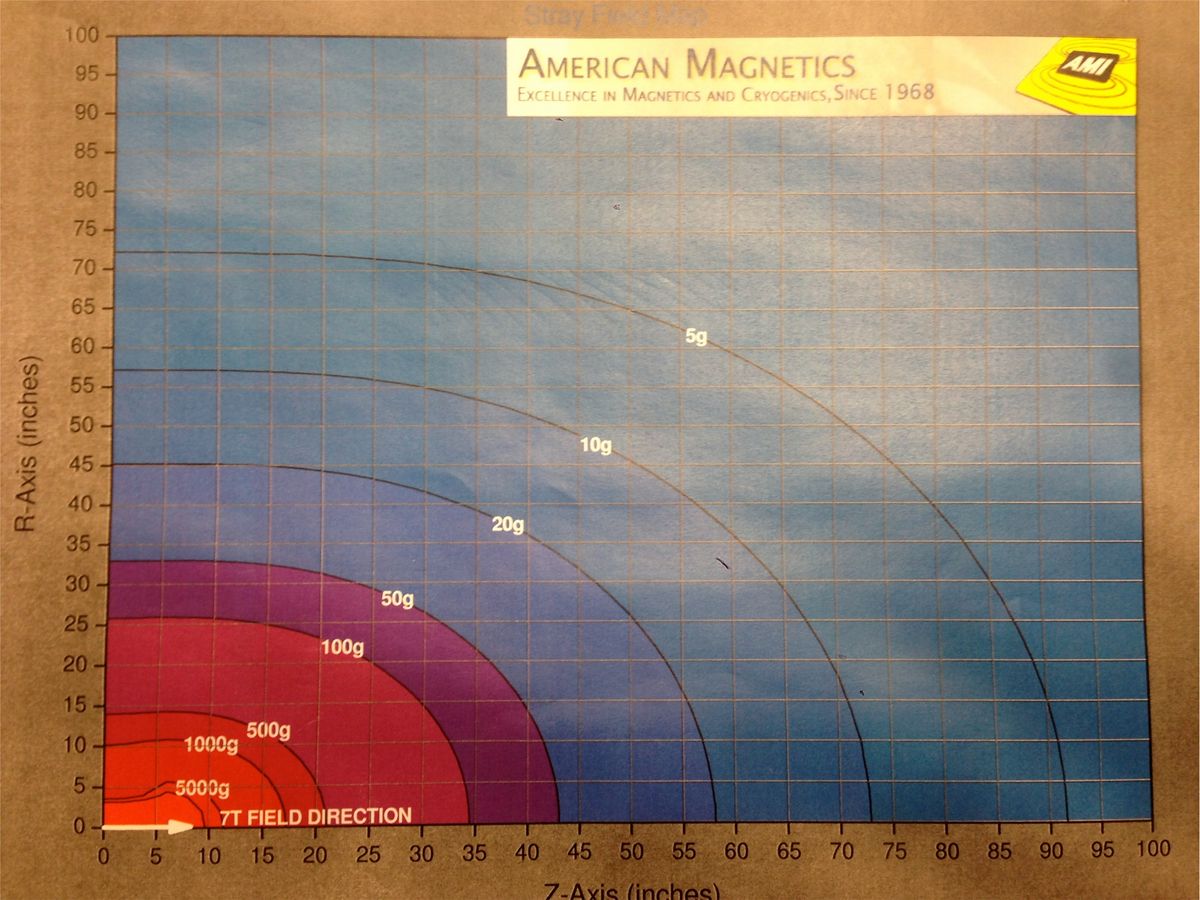
| AMI Magnetic Field Mapping at 7T | ||
| File:2014-01-magmap-ami.pdf | ||

| ||
